If you have ever wondered what the best and cheapest protein powder is, you have come to the right place.
In this helpful article, we explain how you can determine the best protein for your goals. Then we provide a useful tool for you to easily compare the cost and benefits of your protein powder choice.
When you are done with this article, you’ll be able to easily determine what kind of protein is best for you and at the right price.
Which is the best and cheapest protein powder?
There are many ways to determine the best and cheapest protein powder, largely depending on your goal. If you are basing your choice solely on price, then pea protein is your best option at about $0.75 per serving. If you are basing your decision on biological value (BV of 104), then whey is by far the best choice.
Before making your final decision, let’s look at other important facts that may help you make a more informed decision.
How to choose the best and cheapest protein powder

This is a graph of the essential amino acid (EAA) contents of common protein sources and human skeletal muscle protein. White bars are plant-based protein sources, grey bars are animal-derived protein sources, and black bar represents human skeletal muscle protein. The dashed line represents the amino acid requirements for adults. This graph can be found here.
When you purchase a protein powder, ask yourself the three following questions:
- Is your choice based on facts or opinions?
- How do you know the one you buy is right for your needs and goals?
- How do you evaluate your results?
Z Natural Foods is here to help unravel the complexity and answer the question;
What is the best protein powder……for you?
Is there a defined set of guidelines (besides your specific goals) to determine the best source of protein? The simple answer to this question is no.
Therefore, it is best to look at a wide range of parameters for what determines different aspects of protein quality. But please don’t be concerned, as we are here to provide you with high-quality, accurate information to help you make sound and informed decisions.
So, let’s get started.
First, depending on the source of food from where you are getting your protein, you can count on the fact that a wide range of nutrients and compounds are also found in that food source.
Therefore, all sources of protein provide us with much more than just protein. For example, meat and marrow bones provide us with nutrients like coq10, collagen, and B12.
With that as a very simple framework to gauge protein sources, this section will discuss specific areas that are essential in determining how we define an excellent protein source.
The four critical factors for determining the best protein powder are
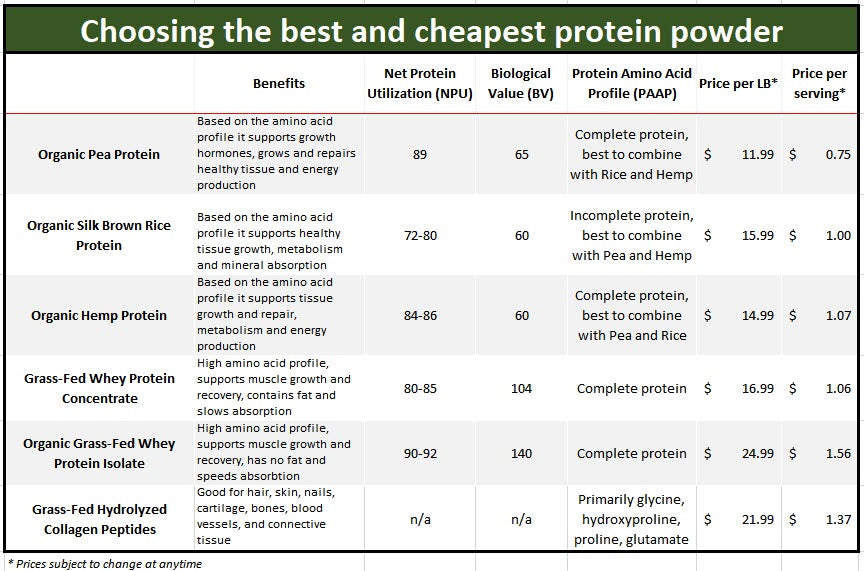
This is a table comparing six of the best and cheapest proteins offered by Z Natural Foods. The best protein defined as the protein with the highest biological value (BV) is Organic Grass-Fed Whey Protein Isolate. Alternatively, the cheapest protein as defined as the lowest price per serving is Organic Pea Protein.
Here are each of these factors explained:
1. Protein efficiency ratios (PER)
PER measures the nutritional value of protein sources.PER determines the results by dividing the weight gain of a test subject by its intake of a particular food protein during the testing period. To date, this method has only been done on mice and rats, but it is believed that aspects of results do correlate to humans. In a study looking to assess in vivo and in vitro quality methods, protein efficiency ratios, and net protein ratios (How much protein we use from what we consume) of 15 different sources of protein, rats were fed a 10% protein diet for fourteen and twenty-eight days.
The protein qualities were expressed compared to casein, which is (across the board) one of the top protein sources.
The result determined the following; “RPER (protein efficiency ratio) values of nonfat dried skim milk (unheated) and tuna were more than 100% that of casein; nonfat dried skim milk (heated), chickpeas, and breakfast sausage were between 50 and 70% of that of casein; and pinto beans and rice-wheat gluten cereal did not support substantial growth of the rat. The NPR (net protein ratios) method did not always rank the protein sources in the same order as the PER method. For the poor quality proteins, RNPR values were much higher than the RPER values; however, the RNPR and RPER values agreed closely for high-quality protein sources.”
Based on the (PER) parameter, the top three proteins are
- Egg (PER 3.9),
- Whey (PER 3.2), and
- Meat (PER 2.9).
2. Net Protein Utilization (NPU)
NPU is the ratio of amino acid mass converted to proteins to the abundance of amino acids supplied.
In simple terms, NPU describes how much protein our body can use compared to what we ingest at a given time.
It is vital to note that this concept is severely affected by the level of limiting amino acids in a given food. This comes down to quality (availability of amino acids) and digestibility.
An article in the American Journal of Clinical Nutrition discussed the ingested protein dose response of muscle and albumin protein synthesis after resistance exercise in young men. It was concluded that consuming 20 grams of intact protein maximally stimulates muscle protein synthesis and albumin protein synthesis. Leucine oxidation was increased after twenty and forty grams; this is important because Leucine can potentially prevent muscle breakdown.
The top three contenders using this parameter are Egg (94), Whey (92), and Beef (73).
3. Biological Value (BV)
BV measures how efficiently the body utilizes each source of protein from the diet.
Foods with a high BV correlate to an increased supply of essential amino acids.
The equation of biological value is calculated from the nitrogen used for tissue formation divided by the nitrogen absorbed from food, then multiplied by 100.
In simple terms, it is the percentage of nitrogen utilized.
Nitrogen is a core component of amino acids, the building block of protein, and nucleic acid, the building block of genetic material.
Concerning BV as the marker, these proteins take the top three spots:
- Whey (BV 104)
- Egg (BV 100)
- Beef (BV 80)
4. Protein Amino Acid Profile (PAAP)
PAAP looks at several factors regarding the amino acids present in a specific source of protein.
First is whether all nine essential amino acids are present to create a complete protein.
Next is whether particular amino acids are in higher amounts than others for optimizing specific results.
Both animal and plant proteins comprise around 20 amino acids, and the proportion of these amino acids varies with each protein source.
Amino nitrogen accounts for about 15% of a protein's total weight. For clarity, this specific parameter is only relevant if you are being consistent with your baseline diet and trying to increase levels of specific amino acids to obtain a particular result.
For example, higher leucine may prevent muscle breakdown, or higher proline, glycine, and hydroxyproline support collagen levels.
Now, we will compare the different protein powder sources based on the above criteria so you can decide based on facts versus opinions.
Please be aware that these numbers can vary depending on the source of information. Therefore, we are using median numbers.
Pea protein
- (BV) is 65
- (NPU) is 89%
- (PAAP) Complete protein high in BCAA’s
- Low in cysteine and methionine
Go here to review an excellent chart a reference for comparing the amino acid profile of pea and whey proteins.
Whey protein
- (BV) concentrate (cow and goat) 104 and Isolate is 140
- (NPU) concentrate (cow and goat) 80-85% and Isolate is 90-92%
- (PAAP) concentrate (cow and goat): complete protein high in BCAA’s, specifically Leucine
- Isolate: complete protein high in BCAA’s, specifically Leucine
Rice protein
- (BV) 60
- (NPU) 72-80%
- (PAAP) Not a complete protein; 18 total amino acids, eight essential amino acids
- High in cysteine and methionine, Low in Lysine
Here is a good table comparing amino acid profiles of rice protein to whey protein
Hemp protein
- (BV) 60
- (NPU) 84-86% yield 50% protein for whole hemp seeds
- (PAAP) A complete protein containing all nine essential amino acids, low in lysine, high in methionine (the highest of all plant proteins), and cysteine.
Here is a chart comparing the percentage of total protein between rice, hemp, pea, and whey.
Hydrolyzed Collagen
Collagen is a protein the body produces that plays a critical role in supporting the structure and function of hair, skin, nails, cartilage, bones, blood vessels, and connective tissue. It is the human body's most abundant protein, representing 35% of its dry weight.
First, it is crucial to understand that hydrolyzed collagen may go by several other names, like collagen hydrolysate and collagen peptides.
While it's an incomplete protein, collagen is unique in the fact that it provides the body with an enormous amount of specific amino acids - glycine, hydroxyproline, and proline - that are most predominant in collagen production.
Hydrolyzed collagen because collagen is a unique protein that supports the development and production of collagen in the body
Next, all collagen, by definition, is technically hydrolyzed, but there are different levels to this process (partially and fully).
For example, gelatin is partially hydrolyzed, and collagen peptides are fully hydrolyzed. Finally, hydrolyzed collagen is, by definition, a denatured protein, although not a complete protein.
Hydrolyzed collagen contains 19 amino acids and 8 of the nine essential amino acids (missing tryptophan).
Hydrolyzed collagen is primarily made up of the amino acids Glycine (33% of total collagen), hydroxyproline and proline (22% of total collagen), and glutamate (derived from its precursor glutamine and an essential precursor for proline).
Cost of protein powders
- Organic Pea Protein, $11.99 per lb
- Organic Silk Brown Rice Protein, $15.99 per lb
- Organic Hemp Protein, $14.99 per lb
- Grass-Fed Whey Protein Concentrate, $16.99 per lb
- Organic Grass-Fed Whey Protein Isolate, $24.99 per lb
- Grass-Fed hydrolyzed Collagen Peptides, $21.99 per lb
The bottom line: How do you evaluate whether your protein powder supports your goals and results?
Ultimately, choosing the best protein comes down to your digestion and your ability to utilize what you consume.
Your age and current health status will affect these factors.
If you are in your late 20s, healthy with no known digestive issues, making this choice would be significantly easier.
Simply follow the guidelines of the experiment (you are about to read below) and see how things go.
If you are in your 60s, there are specific issues that can be assumed. For example, the average individual in their late 60s may have more significant potential for being deficient in hydrochloric acid and pancreatic enzymes; both directly affect digestion and absorption.
Properly utilizing those tools can be a game changer. But, if you have digestive issues that are not being addressed, it will significantly diminish the value of the above parameters and your results.
While the above parameters are important, it comes down to either experimenting most strictly or looking at a wide range of blood values for specific responses (protein markers, amino acid profiles, stool samples for assessing digestion and absorption, and inflammation levels).
New Score Measures Protein Digestibility
How to calculate protein digestibility corrected amino acid score (PDAAS)
Up to this point in this article, we have looked at many parameters like denatured versus undenatured proteins, animal versus plant protein sources, protein efficiency ratio, amino acid profiles, and net protein utilization.
While these parameters are not perfect, they all lend a hand in looking at the big picture for what protein source may be best for you.
Well, it is time to throw one last log on the fire to look at how humans digest and utilize proteins as we inch closer to providing more clarity on a rather complex topic.
Understanding how different parts of the intestines utilize protein and amino acids is vital to complete this puzzle.
The terms used to describe this function are:
Protein digestible indispensable (EAA’s) amino acid scores and nitrogen capacity.
Protein digestibility amino acid score (PDAAS) is the first method to measure Indispensable amino acids (IAA), aka essential amino acids bioavailability, as a marker of total intestinal tract digestibility.
The amino acid scores are calculated as:
The ratio between Indispensable amino acids in food (mg per gram of protein) and their requirements of a reference population.
Please refer to the chart below.

Digestible indispensable amino acid score (DIAAS) requires measurement of the ingredient's essential amino acid (IAA) content.
This score depends on the ileal (the last part of the small intestines) amino acid digestibility.
It uses the true ileal digestibility of IAA;
Total IAA x ileal amino acid digestibility coefficient = total ileal digestible Indispensable amino acids.
While DIAAS is considered the accurate representation of protein quality, it may not address the disappearance of amino acids that may be otherwise unavailable for protein synthesis.
Protein and the large intestines
Different proteins and amino acids infused into the large intestine significantly increase fecal nitrogen extraction.
The capacity of nitrogen in the large intestine is significant, with the majority excreted into the urine as urea.
But, it is only efficiently assimilated when total nitrogen (dispensable AA content) is a limiting nutrient in the diet.
About 25%-55% of nitrogen entering the large intestines is dietary, and 85% of fecal nitrogen output is a bacterial protein. In the end, while human colonocytes have the capacity for amino acid absorption(because transporters are present in the large intestines), the absorption of nutritionally appropriate amounts of indispensable dietary amino acids in the human large intestines has yet to be convincingly demonstrated.
The limiting factor of protein digestibility amino acid score (PDAAS) is that using total tract protein digestibility can overestimate amino acid bioavailability of protein with poor Ileal digestibility.
How does the microbiome affect amino acid profiles?
In order to answer this question correctly, it is vital to understand the function of our microbiome.
The microbiome is the genetic material of all microbes (bacteria, fungi, and viruses) that live on and in the human body.
The gut microbiome may have many positive effects, like supporting a healthy immune system response, possibly protecting the host from a pathogenic invasion, and metabolizing non-digestible components from food.
The microbiome has the ability to modify the amino acid profiles by catabolizing or synthesizing amino acids.
For example, threonine and tryptophan are degraded more significantly than other ILeal (the last part of the small intestines) amino acids.
Fiber can increase microbial activity and nitrogen levels from non-dietary sources.

So, what does all of this mean?
In a nutshell, this is one more marker you can use to evaluate the quality and bioavailability of various protein sources to make a well-informed decision about what type of protein powder is right for you.
Like all the other markers, this could be better, but it is the closest reference to human protein consumption and utilization.
It also allows us to better understand how the digestive system utilizes protein.
In the end, no matter how much research you do on a topic, there is one fact that will always be true;
Only you know your body, and trying various sources of protein powders to see how you digest them, is the best way to determine what may be best for you.
Let’s finish this article with 4 ways to perform your own experiment.
4 simple ways to perform your experiment and find the best protein powder for your goals
Please keep in mind that these are general guidelines.
When you test and experiment with choosing the best protein powder for you, do your best to adhere to the following:
- A consistent baseline diet that you have been on for at least 30 days and will not change for the extent of the investigation.
- Determine what factors you want to use as a guideline, i.e., weight gain, weight loss, body fat, and strength.
- Add a source of protein powder to your diet, always beginning with a single source at a specific amount for a specified time frame.
- Review a wide range of long- and short-term factors.
If the protein produces gas, bloating, or goes right through you within two hours of ingestion, this may not be the best source to optimize your results.
If none of those issues occur, and if you decide to use this protein for 90 days, evaluate your results against your goals every thirty days.
Please keep in mind one final factor that plays a vital role in this experiment.
Many people have incredibly mild or delayed reactions to foods that may not appear as a more significant problem for years.
Therefore, it would take a lot of work to connect the dots.
In the end, if you see a progression of good results, you are on the right track.
Medical Disclaimer: The information in this article is for educational purposes only. It is not intended to treat, prescribe, or diagnose any specific medical condition. It is also not to be used as a replacement for your healthcare provider's diagnosis, treatment, or medical advice.